TAC Flow
Fleet Management System
Developed by Ezzat Mekkawi
📞 0533311588·✉ info@tacflow.app
© 2025 TAC Group
· All rights reserved
Skip to content
Home
PricingIndustriesIntegrationsAboutFAQContact us
Find an asset
Sign inRequest a demo
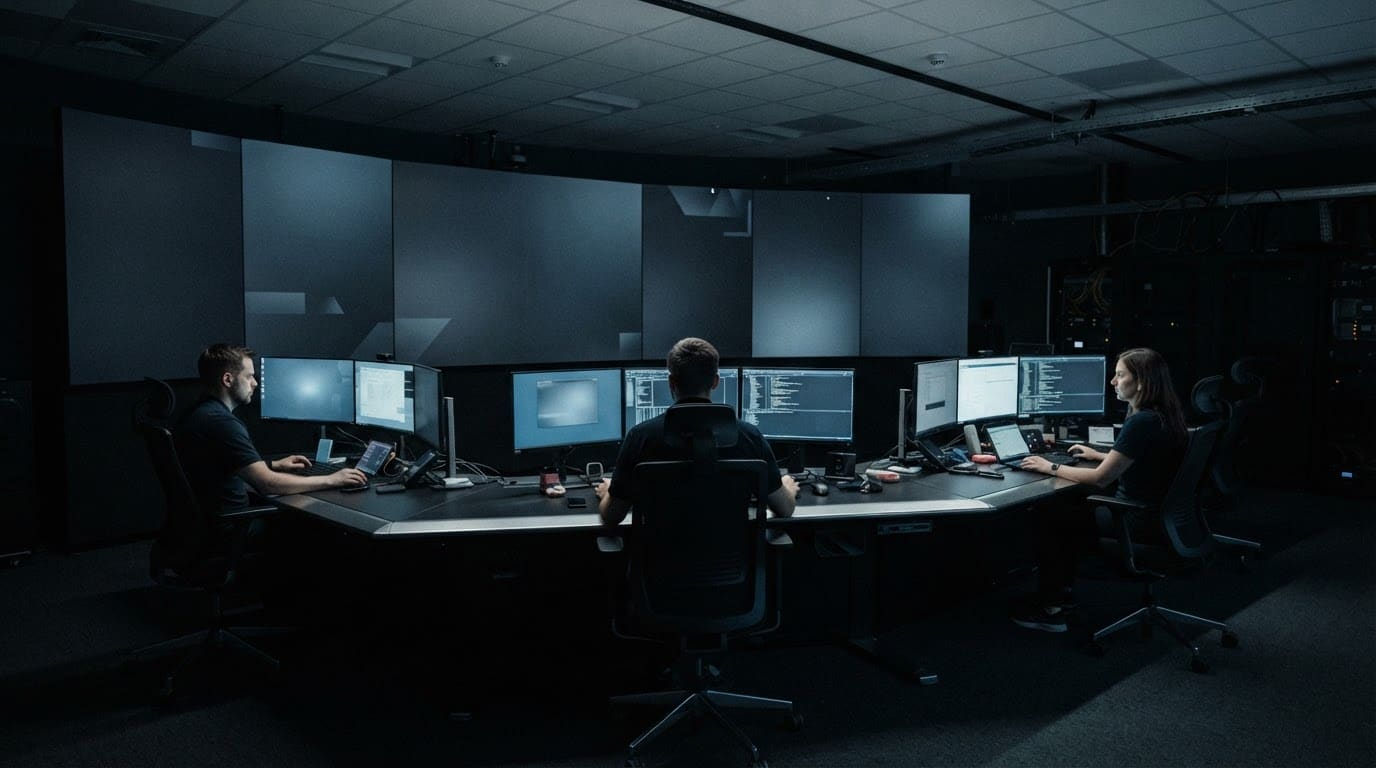
Monitoring screens showing fleet operating indicators
HomeReports Center
Business & decisions

Reports from the same data the field records

No re-entry and no parallel spreadsheets. Every report is built from approved records, with comparisons across projects and periods, and an analytics assistant that answers from your data and shows the source of every number.

Request a demo of this moduleWhat it does, exactly
Before

What happens today without this module

  • 01The report is compiled manually at month-end, after the time to correct has passed
  • 02Numbers differ from one department to another because each aggregates differently
  • 03No comparison is possible across projects for lack of a unified classification
Capabilities

Exactly what this module does

  • Around 25 report pages

    Readiness, movements, documents, maintenance, fuel, inventory, and custody — and only what belongs to your enabled modules appears.

  • The report review queue

    Maintenance and inspection reports arriving from the field are reviewed and approved here before their numbers enter any report.

  • Asset cost

    Maintenance, parts, fuel, and hours in one figure, with a monthly trend across 6 cost categories.

  • Project comparison

    Each site’s performance and cost against the others.

  • The analytics assistant

    A question in Arabic and an instant answer from a live snapshot confined to your company’s data — read-only.

  • Export and scheduled sending

    Structured output, and reports arriving by email on a schedule you set.

Inside the service

How it actually works in your company

A report compiled by hand at month-end arrives after the time to correct anything has passed, and its numbers differ depending on who compiled it. The reports hub builds every report from the same records the field entered and the workflows approved: asset readiness, movements, documents, maintenance, oils, inventory and custody — with a review queue deciding what enters the count at all, and an analytical assistant answering read-only from your company's live data. Only the reports belonging to your enabled services appear, per user, per role.

01

A hub that knows each user

Reports appear as cards grouped into categories, and the list is not the same for everyone: each card is filtered by both the viewer's role and the company's enabled services, and a category that empties disappears with its heading. A disabled service leaves no trace — no card, no number — and a manager outside a report's audience never sees it. Readiness reporting shows assets as ready, on site, or in maintenance at a filter's click, alongside movements, documents, oils, inventory, receipts, custody and accidents.

02

Approval before counting

Maintenance and inspection reports arriving from the field wait in a review queue before their numbers enter any calculation: the reviewer sees photos, readings and tasks; a reading that jumped abnormally arrives flagged with the technician's confirmation; a locked meter blocks approval until its reading is completed; a broken meter is approved without a reading and opens a fault report automatically; and a report written in a foreign language arrives translated with its original language noted. The number that reaches management is a reviewed number — not everything that was sent.

03

Costs computed from your settings

The maintenance report goes beyond counting: it computes each technician's work hours and success rate, and prices labor cost and downtime cost from the hourly rates your company sets in its settings — so the cost of a single fault report comes out as a figure combining the technician's wages and the price of the machine standing idle. The numbers hold up in argument because their inputs are visible: a labor rate and a downtime rate management entered itself, not a hidden assumption.

04

Export and scheduled delivery

Report pages export spreadsheets for sharing and archiving, and build print-ready documents in the system's unified report identity. Whoever does not open the dashboard daily receives scheduled email reports: the manager sets the delivery schedule once, and the system builds and sends the report on time without intervention. All of it reads from the same approved records, so no parallel version of the truth ever forms inside the company.

05

An assistant that never writes

The analytical assistant answers in Arabic from a live snapshot confined to your company's data: a deterministic local engine that matches the dashboard's own numbers, responds instantly at no cost, and sees only what your enabled services expose. The path is entirely read-only — it edits no record and takes no operational decision — it is rate-limited against flooding, and external intelligence is an option switched off by default that runs only on the company's explicit decision.
Inside the product

The screen as your team uses it

Reports Center
Screen of Reports Center
The flow

How the process runs end to end

  1. 01

    Field recording

    Data enters once, at its source

  2. 02

    Approval

    The workflows approve what enters the reports

  3. 03

    Report

    Indicators and comparisons with no manual compiling

  4. 04

    Decision

    An alert on what deserves intervention

After rollout

What actually changes

No promises built on numbers we don’t know about your company. What follows is the structural difference of wiring this module into the rest of the platform.

One number
no two versions of the truth
Early timing
before month close
A visible source
every number traces back to its record

Limits of this module

The analytics assistant reads and never writes: it edits no record and takes no operational decision.

Works with

Modules that complete the picture

All modules
  • Fuel Card Analytics

    Import provider statements and catch anomalies

    Learn more
  • Preventive Maintenance

    Plans and reminders on meter or date

    Learn more
  • Projects

    Sites, supervisors, and asset assignment

    Learn more

Try Reports Center on your own assets — not a generic example

We tailor the demo to your operation, starting with the module that blocks your team today.

Request a demoHome

TAC Flow is an integrated platform that unifies operations in one digital environment, connects the field to management, and turns daily data into clear insight — helping companies tighten control, raise asset efficiency, cut costs, and make faster, more accurate decisions.

  • 0533311588
  • info@tacflow.app
  • sales@tacflow.app
  • Chat on WhatsApp
  • Riyadh, King Abdulaziz District

Fleet & assets

  • Heavy Equipment
  • Vehicles & Trailers
  • Asset Movements
  • Documents
  • Internal Diesel
  • Fuel Card Analytics
  • Transport & Trips
  • Renting from Suppliers
  • Renting to Customers

Maintenance & safety

  • Fault Reports
  • Preventive Maintenance
  • Daily Inspection
  • Inventory
  • Parts Receiving
  • Oils
  • Tires
  • Accidents

Business & decisions

  • Projects
  • Field Force
  • Operators & Staff Register
  • Reports Center
  • Integrations & API

Company

  • About
  • Blog
  • Integrations
  • Plans & pricing
  • FAQ
  • Cost calculator
  • Governance & permissions
  • Industries

Field & account

  • Find an asset
  • Scan asset code
  • Start your free trial
  • Sign in
  • Request a demo

All rights reserved to TAC Flow 2026 · Commercial registration 7038510140

Privacy policyTerms & conditions